

Motherboard Diagnostic Tool: Top 5 Faults Found in 2026
The popular advice is simple: buy a PCI POST card, read the hexadecimal code, and you'll know what failed. That advice is incomplete for modern laptops, desktops, and soldered mobile boards. A useful motherboard diagnostic tool is now part of a layered bench process that combines boot-stage evidence, electrical measurements, thermal inspection, and operating-system testing.
Updated for March 2026, this guide focuses on five fault patterns and the tools that help isolate them. The central rule is practical: use a POST analyzer when the board can't boot, software when it can, and electrical or thermal instruments when the code alone doesn't identify the cause.
Why a Single POST Card Is No Longer Enough
An eSPI-only laptop can receive standby power, respond to the power button, and still leave a traditional PCI POST card with nothing useful to read. That failure is not unusual on newer compact boards. The diagnostic path may sit behind eSPI, a TPM header, or a service connector rather than an accessible PCI slot.
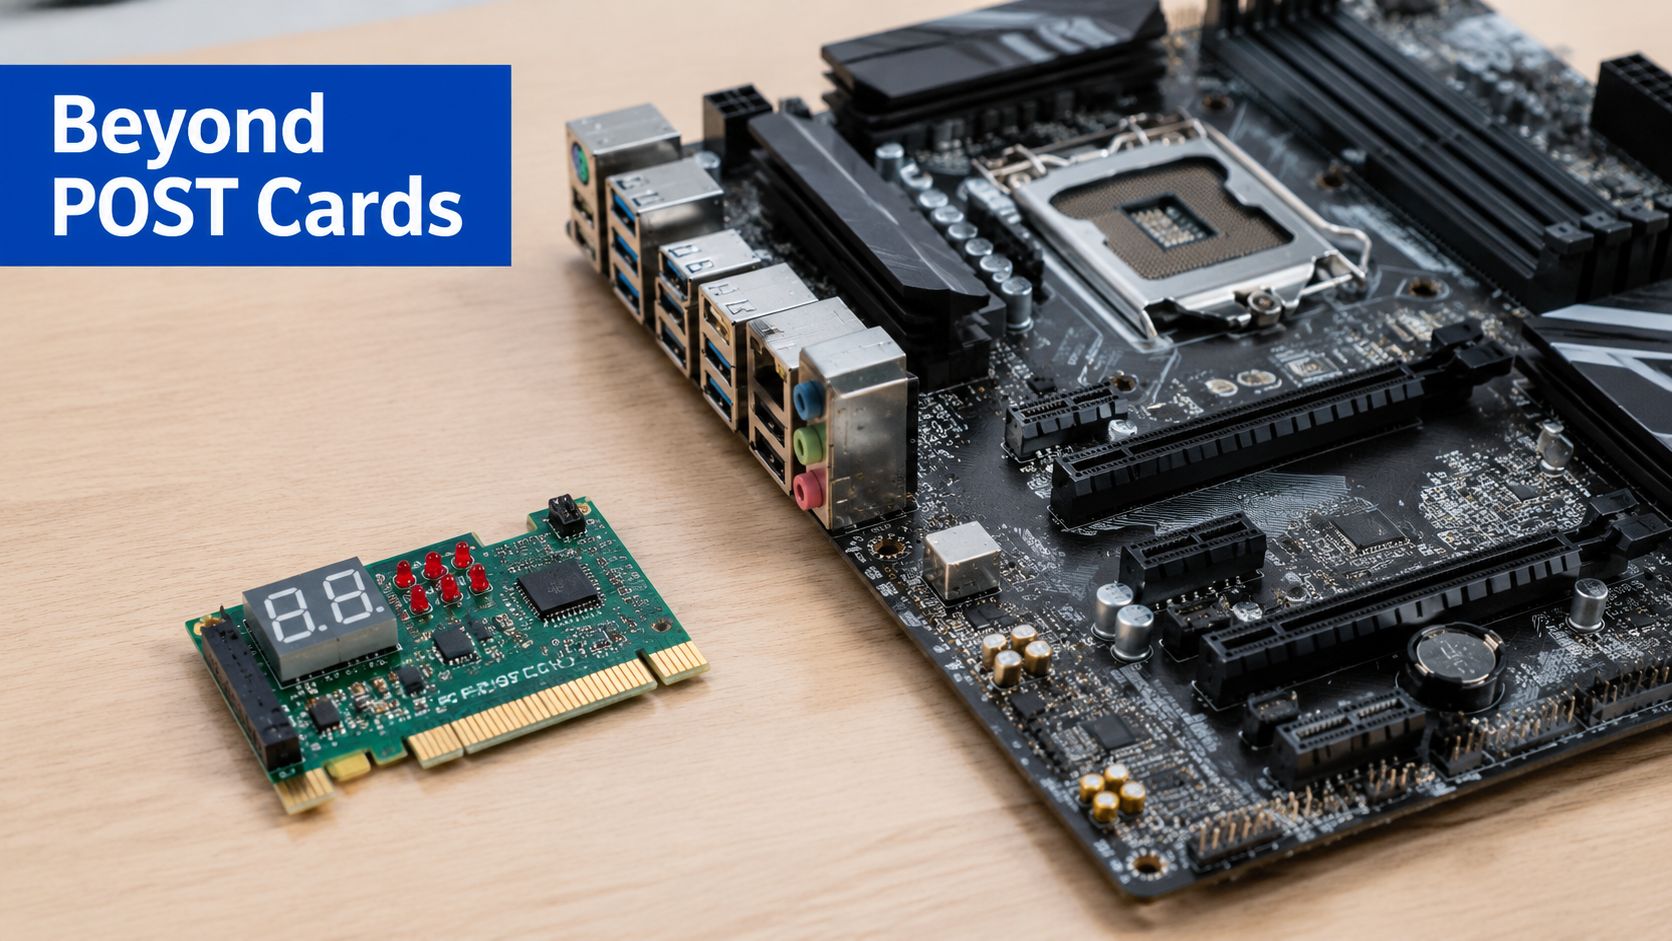
A conventional POST card remains useful on compatible desktop hardware. It monitors boot-stage activity and can show where initialization stops during power sequencing, CPU startup, memory training, or firmware execution. Its value depends on two conditions: the board must expose a readable debug path, and the displayed code must be documented well enough to guide the next test.
Modern board layouts therefore require interface matching before a card is connected. Depending on the design, the available route may be LPC, eSPI, TPM-header, mini PCIe, PCIe, or PCIe x1. An analyzer built for one interface cannot automatically interpret another, and a code captured through an unsupported adapter may be misleading.
Tool choice follows the fault
Start with the board's symptoms and accessible test points:
- Bench power supply: Applies controlled power and current limiting while you watch for an abnormal load or a rail that never starts.
- Digital multimeter: Checks standby and main rails, continuity, resistance to ground, and suspected short circuits.
- Thermal imaging camera: Locates regulators, memory devices, and power-management parts that heat before the board reaches a useful debug state.
- POST or debug analyzer: Records boot-stage activity when the board exposes a compatible interface.
- Software suite: Tests temperatures, voltages, clocks, fan behavior, storage health, and stability after the operating system loads.
Repair guidance on current motherboard fault isolation places thermal inspection, rail-voltage checks, and debug cards together because a hexadecimal code identifies a stopped stage, not necessarily the failed component. This repair guidance on modern motherboard fault isolation reflects that bench practice.
Bench rule: Treat a POST code as a location marker in the boot sequence. Confirm the suspected fault with measurements before replacing a part.
A thermal image also needs electrical context. Use this thermal imaging camera guide to interpret hotspots correctly. A warm component may be operating normally, shorted, or receiving incorrect power, so verify it with meter readings and circuit knowledge.
The common purchasing error is choosing a legacy card before identifying the board's debug interface. On a current laptop or compact desktop, there may be no suitable connector, or the firmware may provide codes that are poorly documented. In that situation, the useful diagnostic tool is the combination of accessible signals, electrical tests, and thermal evidence, not the card alone.
How Motherboard Diagnostic Tools Read Boot Errors
The foundation is Power-On Self-Test, or POST. POST runs before the operating system and checks whether the platform can initialize enough hardware to continue booting. The original IBM BIOS included POST and used port 0x80 for diagnostic output. Later BIOS versions added beep-based error codes for systems where a screen wasn't available, as documented in the history of Power-On Self-Test.
That history explains why modern debug analyzers still display hexadecimal values. The board's firmware emits progress information, and a compatible analyzer observes that activity through an exposed interface. If initialization stops, the final code can point toward the stage that failed.
What happens during a no-boot test
- Power reaches the board. Standby power is present, the power button signal is detected, and the platform begins its startup sequence.
- The firmware starts POST. The CPU begins executing firmware instructions and the board checks basic initialization conditions.
- The firmware sends diagnostic activity. Older systems commonly exposed this through port 0x80. Newer boards may route useful signals through different debug interfaces.
- The analyzer observes the path. A compatible card connected through PCI, mini PCIe, LPC, or PCIe x1 can capture the available boot information.
- The display holds the last state. Dual-digit hexadecimal displays and automatic code-hold behavior keep the final POST state visible after failure, which is useful when the board resets or enters a boot loop.
A hardware analyzer can therefore answer a valuable question: where did the board stop? It can't always answer the next question, which is why did it stop there? A memory initialization code may result from defective RAM, a damaged slot, an unstable memory rail, a CPU memory-controller problem, or firmware incompatibility.
The beep path remains useful when no display output exists. For a practical reference, keep a mainboard beep-code guide alongside the board's own manual. Beep patterns vary by firmware and manufacturer, so don't apply a generic table without checking the platform.
A code becomes much more useful when you record the conditions around it. Note whether the board has a CPU installed, whether memory is fitted, whether the display was connected, whether the reset repeats, and whether the code changes after a known-good component is substituted. That turns a static number into a diagnostic comparison.
Hardware Testers Versus Software Diagnostic Suites
Hardware and software tools answer different questions. A POST analyzer works before the operating system loads, so it's valuable when the board never reaches a display, repeatedly resets, or stops during CPU and memory initialization. Software tools only become useful after the platform has booted far enough to run an operating system or a bootable diagnostic environment.
A 2026 hardware-diagnostics guide divides motherboard diagnostic software into inventory tools, monitoring tools, and stress testers, with each category serving a separate purpose. The guide's software classification is a useful starting point when choosing a suite.
| Capability | Hardware POST Analyzer | Software Diagnostic Suite |
|---|---|---|
| Pre-boot failure detection | Strong, if the board exposes a compatible debug path | Limited or unavailable |
| CPU and RAM initialization faults | Can show the stage where initialization stops | Usually requires a bootable environment or a working operating system |
| Live temperatures and fan RPM | Not its main function | Strong |
| Voltage observation | Requires separate meter testing | Can report sensor readings, but firmware sensors aren't a substitute for a meter |
| Storage SMART attributes | Not normally available | Strong after the storage device is recognized |
| Load-dependent crashes | Cannot reproduce operating-system workloads | Stress testers can apply controlled loads |
| Firmware interpretation | Shows codes that require board-specific lookup | May identify firmware, drivers, and platform configuration |
| Soldered laptop or phone components | Requires board-level access and suitable instrumentation | Often limited by operating-system access |
When the board won't POST
Start with a hardware path. Confirm standby power, inspect for visible damage, remove unnecessary peripherals, and use a compatible analyzer if the board provides an accessible interface. If the analyzer stops at a CPU-related stage, verify power delivery and cooling before condemning the processor.
A software suite won't replace those checks. It can't monitor a system that never initializes, and it can't read a storage device that the firmware fails to detect.
When the system boots but fails later
Use software for inventory, observation, and controlled loading. Inventory tools identify the CPU, motherboard, graphics processor, memory, storage, firmware, drivers, and supported capabilities. Monitoring tools expose live temperatures, clocks, fan speeds, voltages, power readings, utilization, and throttling. Stress testers apply workloads that can reveal faults that never appear at idle.
For broader build and component context, the PC upgrade guide is a useful companion. The practical distinction remains clear: hardware tools locate the boot boundary, while software tools characterize behavior after boot.
The Multistep Diagnostic Workflow Professionals Use
Random part swapping creates misleading results. A replacement component may hide the original fault, introduce a second variable, or appear to fix the machine because the board was reseated during the swap. A disciplined motherboard diagnostic tool workflow starts with the symptom and narrows the possibilities before measurements begin.
Repair-oriented diagnostic systems can follow a structured sequence. One described workflow starts with a plain-language symptom report, maps it to known failure rules with confidence scores, checks those hypotheses against circuit topology when schematics are available, and produces ordered measurements such as continuity and voltage checks on specific components. The repair-oriented workflow description explains this reasoning model.
A practical bench sequence
- Write the symptom plainly. “Powers on, no display, fans remain active” is more useful than “dead motherboard.”
- Inspect before powering repeatedly. Look for burnt areas, liquid residue, damaged sockets, loose connectors, missing components, and debris.
- Verify the power path. Check the external supply, connector seating, standby behavior, and relevant rails with a multimeter.
- Capture the boot state. Connect the appropriate analyzer and record the last code, beep pattern, diagnostic LED, or reset behavior.
- Isolate the subsystem. Test memory modules and slots individually, remove the discrete GPU where integrated graphics are available, and disconnect nonessential devices.
- Confirm the repair. Reassemble the minimum working configuration, reproduce the original symptom, and then test the system under its normal workload.
The order matters. A code that points toward memory initialization shouldn't send you directly to a replacement CPU. Check the memory module, slot, socket condition, memory rail, and firmware configuration first.
Keep the board clean and observable
Dust and conductive debris can complicate inspection, especially around sockets and connectors. Use a controlled cleaning method, avoid forcing debris deeper into the board, and let any cleaning agent fully evaporate before applying power. A compact electric wireless air duster can help with loose dust, but it won't replace visual inspection or electrical testing.
Practical rule: Measure the suspected rail before replacing the component attached to it.
Record every result. A simple worksheet containing the symptom, configuration, POST state, measured rails, thermal observations, and retest outcome prevents circular troubleshooting and gives another technician something defensible to review.
Common Troubleshooting Scenarios and Which Tool to Use
The fastest tool depends on where the failure occurs. A system that never produces video needs a different approach from a computer that boots normally and crashes during a game.
A desktop powers on but shows no display
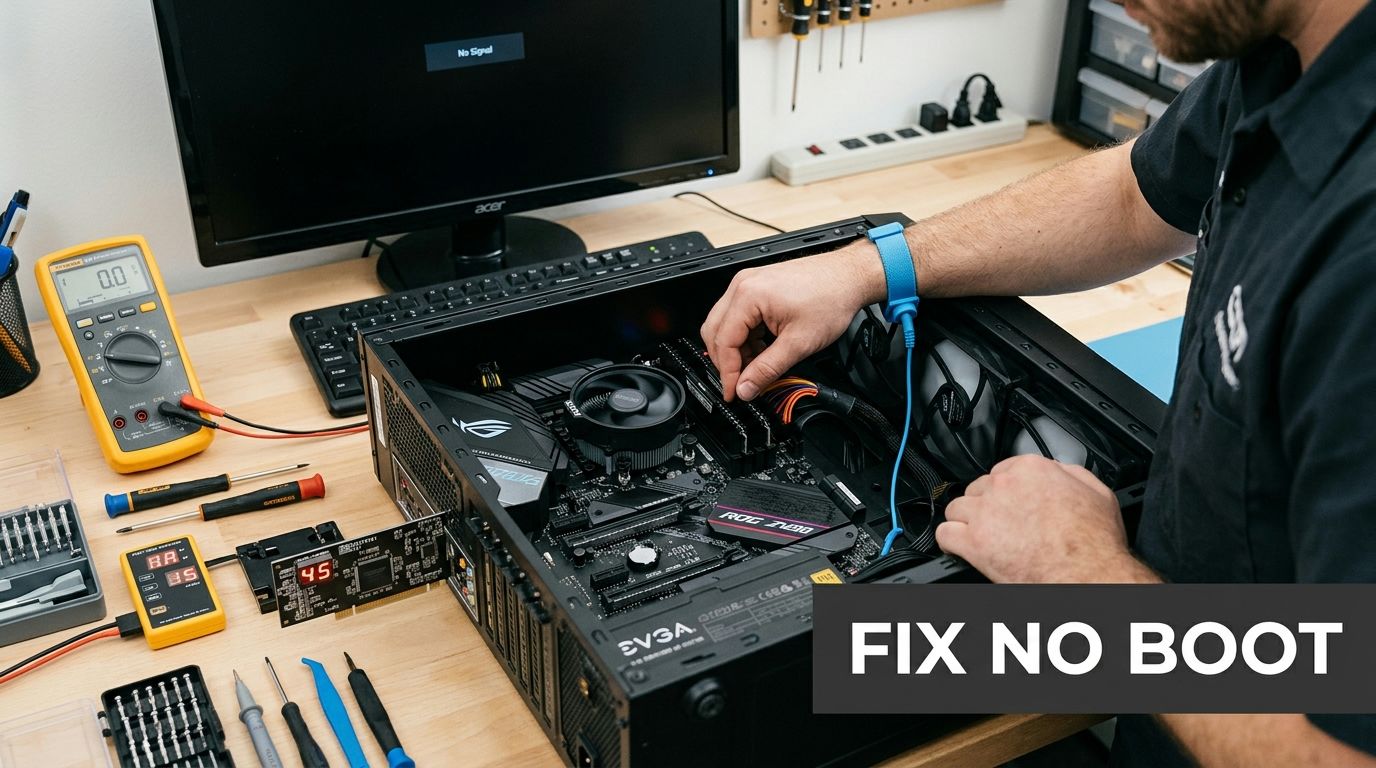
Begin with a POST analyzer if the board exposes a compatible path. Record whether the code advances, freezes, or resets. Then test the minimum configuration, inspect memory seating, check CPU power connections, and verify that the display output matches the graphics hardware being used.
If the board reaches a graphics stage but still shows no image, test the monitor and cable separately. A code is a direction, not a verdict.
The system resets in a repeated loop
A loop can indicate unstable power, failed CPU initialization, memory training trouble, firmware problems, or a shorted peripheral. A code-hold display is valuable because it preserves the final state, while a multimeter and bench supply help determine whether the board's power behavior is stable.
Disconnect storage, USB devices, expansion cards, and front-panel accessories that aren't required for a basic POST. If the behavior changes, add components back one at a time.
Crashes appear only under gaming load
Use monitoring software and a controlled stress test. Independent 2026 listings describe diagnostic suites that collect fan RPM, voltages, thermals, memory timing, storage SMART attributes, and pass or fail stability results, then record those signals for later analysis. This overview of structured diagnostic outputs reflects the information you should capture.
Check whether temperatures, clocks, fan speeds, or power readings change before the crash. A thermal camera can then help identify an abnormal hotspot around the CPU voltage regulator, graphics power circuitry, or another loaded component.
A phone motherboard won't charge
A phone doesn't offer the same convenient PCI or PCIe debug-card workflow as a desktop. Start with the charger, cable, connector, battery condition, and current draw. Board-level work then moves to USB power-path components, charging ICs, protection devices, and relevant rails, using a microscope, multimeter, current-limited supply, and thermal inspection.
For a broader mobile repair reference, Computer Daddy's motherboard guide provides useful context on laptop and board-level fault diagnosis. The specific measurements still depend on the schematic and board layout.
The system passes POST but throttles
This is a monitoring problem first. Log temperatures, clocks, fan RPM, utilization, and power behavior during a repeatable workload. Check cooler contact, fan or pump operation, airflow, firmware settings, and VRM temperatures before assuming the motherboard itself has failed.
Also inspect the power path and cable quality. A properly seated, suitable Longwell power cord won't fix a defective regulator, but eliminating a questionable external connection is a sensible part of controlled testing.
Choosing the Right Motherboard Diagnostic Tool for Your Setup
The old advice, “just buy a POST card,” breaks down on modern boards. Choose the board's debug interface first, then choose the display. A dual-digit analyzer has little value if it cannot reach the exposed LPC or eSPI path, or if the manufacturer provides no usable code documentation. DDR5 platforms also make memory training behavior harder to judge from one code alone.
Field-tested cards may support PCI, mini PCIe, LPC, and PCIe x1, but those interfaces are not interchangeable. Confirm the motherboard's available slot or header, the analyzer's electrical compatibility, and whether the tool can observe activity before the operating system loads. The analyzer interface overview illustrates why interface coverage belongs at the top of the buying checklist.
For a first-time PC builder
Buy for repeatability, not maximum complexity. A multimeter, a compatible POST analyzer, a known-good memory module, and a reliable way to inspect temperatures will solve more faults than an advanced analyzer you cannot interpret.
Look for:
- Interface coverage: Match the card to the motherboard's available slot or header.
- Readable output: A bright hexadecimal display is easier to read on a crowded bench.
- Code retention: Automatic hold behavior helps when the board resets quickly.
- Documentation: Choose tools that explain connection requirements and code meanings.
- Safe handling: Avoid casual probing of powered circuitry and adjacent pads.
For a laptop or phone technician
A desktop PCI card is rarely the first purchase. Prioritize a current-limited bench supply, quality multimeter, microscope access, thermal imaging, and board documentation. An app-connected or multi-interface analyzer can help when it matches the device's LPC, eSPI, TPM-header, or other debug route.
Soldered components change the diagnostic process. You cannot swap a DIMM or processor, so rail measurements, current behavior, thermal evidence, and schematic checks carry more weight.
For an IT professional
A fleet environment benefits from software that inventories platforms, monitors live behavior, runs controlled tests, and preserves structured results. Hardware analyzers remain useful for escalated no-boot cases, but they are inefficient as the only tool for machines that boot normally.
Buying advice: Pay for interface compatibility and usable records before paying for extra indicators you will not interpret.
The practical setup is modular: electrical measurement for power faults, pre-boot analysis for dead systems, and software reporting for machines that reach the operating system.
Frequently Asked Questions About Motherboard Diagnostics
Do motherboard diagnostic tools work on phones and tablets with soldered components?
Some do, but not usually in the form of a desktop POST card. Phones and tablets commonly require board-level instruments such as a current-limited supply, multimeter, microscope, thermal camera, and sometimes a specialized analyzer that matches the device's debug access. Soldered memory and processors make substitution testing less practical, so technicians rely more heavily on rail measurements, current behavior, component temperatures, and board documentation.
How do I interpret POST beep codes without a display?
First identify the firmware or motherboard manufacturer, then use the board's own manual or a source that matches that platform. Beeps indicate that the firmware reached a diagnostic condition, but the pattern doesn't prove a single component has failed. Remove nonessential hardware, reseat memory, check power connections, and compare the beep behavior after one controlled change at a time.
Can free software diagnostics replace a hardware POST card?
No, not for a board that never reaches the operating system. Software can inventory hardware, monitor temperatures and voltages, inspect storage SMART attributes, and stress the system after boot. A hardware tester can expose the pre-boot stopping point, and many motherboard testers provide an 8-LED indication plus an easy-to-read LED display for direct results on the test card, as described by this hardware tester reference. Use both categories when the fault crosses the boot boundary.
DigiDevice offers practical electronics and repair gear for technicians working across phones, PCs, and connected devices, including thermal imaging equipment and specialized diagnostic tools. Visit DigiDevice to compare the equipment that can support a layered motherboard troubleshooting bench, then choose based on your board's interface and the faults you need to isolate.